
The Blueprint
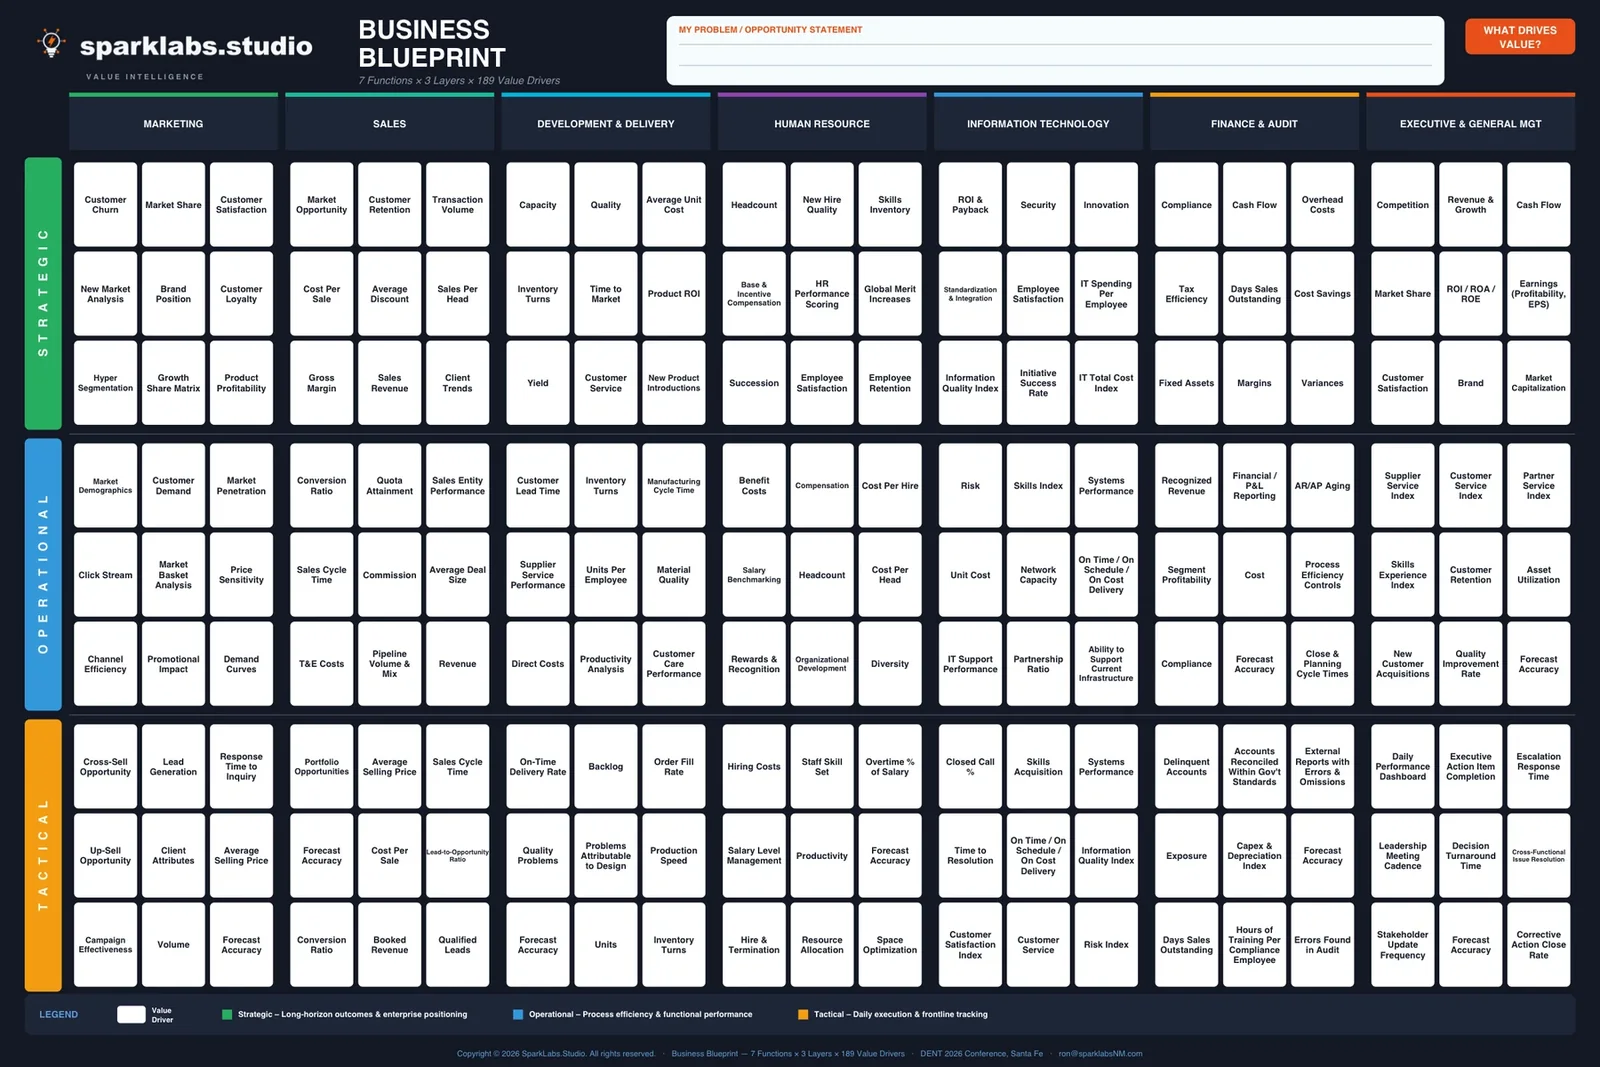
189 value drivers · 7 functions · 3 tiers
A one-page map of how value really moves through an organization, and the instrument behind every Spark Labs engagement.
What it is
The tiers are strategic (long-horizon outcomes and positioning), operational (process and functional performance) and tactical (daily execution and frontline tracking). Seven functions run across the top: marketing, sales, development and delivery, human resources, information technology, finance and audit, and executive and general management. Three tiers run down the side. Every cell holds the value drivers that function controls at that altitude: 189 in all.
Value drivers explain the metrics. A KPI tells you a number moved; a driver tells you which lever moved it, and who owns that lever.
How a session uses it
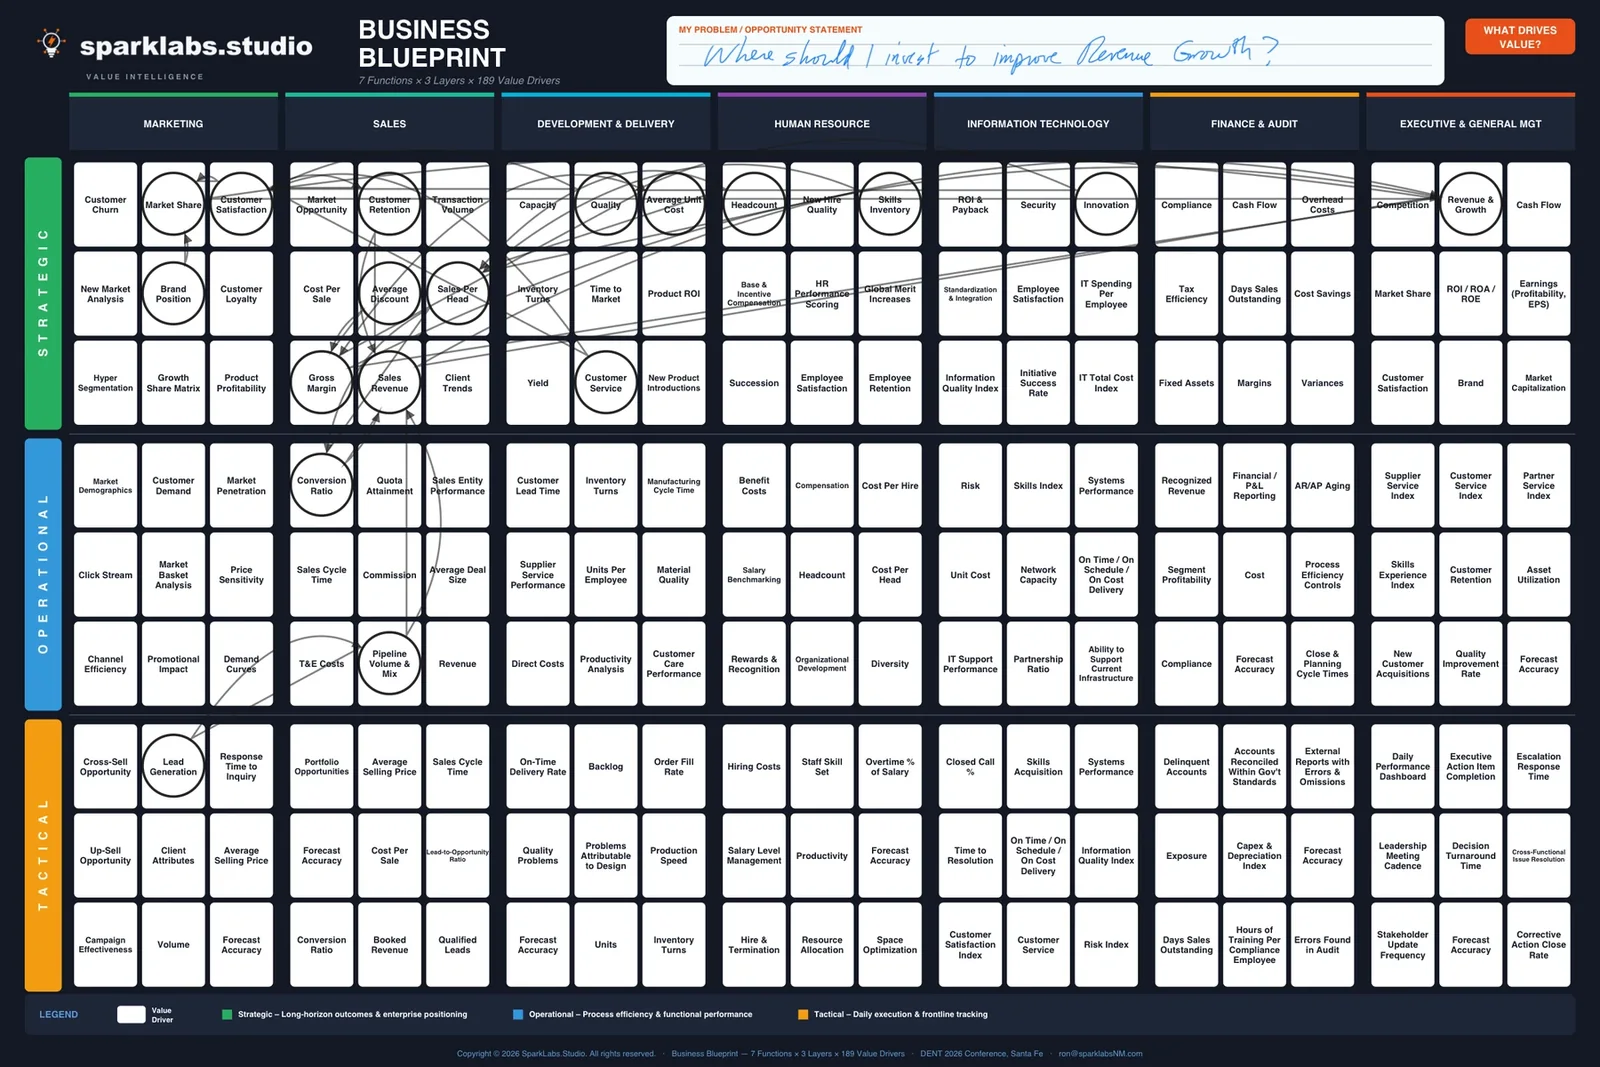
This example asks “Where should I invest to improve revenue growth?” The circled drivers move the answer; the lines show how the effect travels across functions and down the tiers. A session starts with one question written at the top of the map. The room then maps it: which drivers move the answer, and how they connect. With the owners of those drivers convened around the same picture, the argument shifts from opinions to levers. The session closes when the room commits to a one-page plan with owners and dates.
Versions and variants
There is a business Blueprint and a nonprofit Blueprint, with fundraising, programs and volunteers in place of commercial functions. Variants exist for cybersecurity, retail, genomics research, municipal government and LinkedIn’s Marketing Solutions division.
The same logic bends to the decision in front of it. Seven ways it varies:
- Enterprise-wide
- Every function, every tier. The whole organization on one page.
- Function-focused
- One or two functions in more depth, with the enterprise frame kept around them.
- Industry-specific
- Functions and drivers tailored to a vertical, where generic metrics miss what matters.
- Technology-connected
- Extended with data sources and systems, so strategy hands straight to the implementation team.
- Imperative-led
- Corporate imperatives anchored at the top, with their impact traced down into each function.
- Periodic table
- An element-tile layout instead of a grid: the same logic, presented differently.
- Discovery workshop
- Hand-drawn or rough-drafted in the room, before anything is digitized.
Go further
- Other lenses and frameworks that sit alongside the Blueprint.
- The core labs, each anchored to a cell of the Blueprint.
- The repository: solution overlays and client Blueprints, for workshop attendees (sign-in required).